Visualizing alerts using kibana and elasticsearch v0.2.1
As you have already noticed, haka 0.2.1 features new modules enabling to export data to an elasticsearch server. We leveraged on these modules in the Hakabana package to monitor in real-time network data (protocols, flows, geoip info, etc.) through a kibana dashboard.
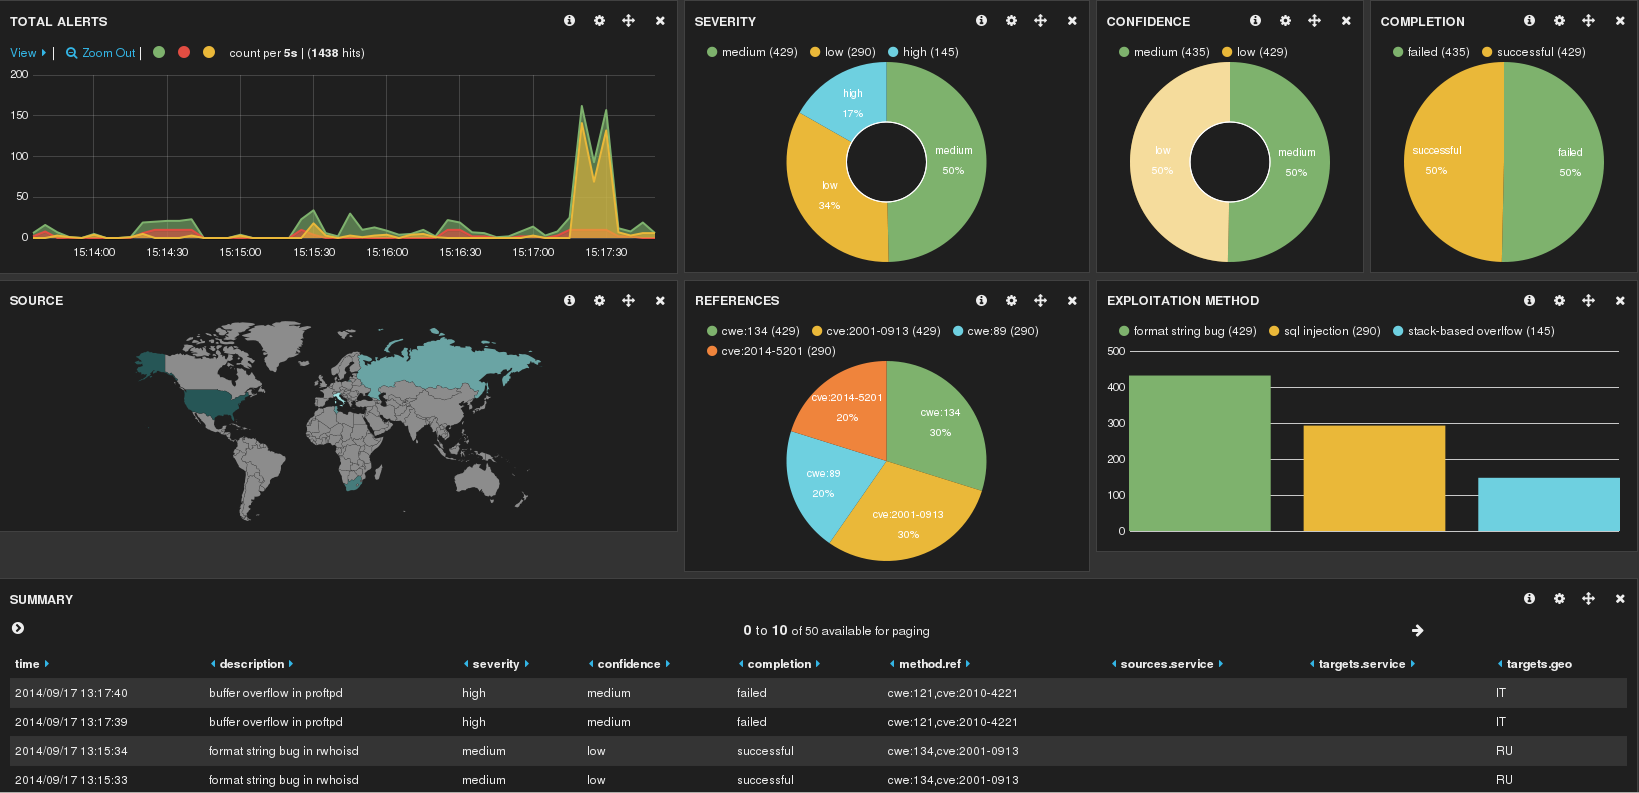
The 0.2.1 version introduces also an elasticsearch alerting module allowing to insert haka alerts into an elasticsearch server. In the following, we present the main steps to visualize these alerts using a kibana dashboard.
Requirements
First of all, we assume that you have already a kibana and elasticsearch installed on your machine. If not, your are encouraged to check the Getting started section to install and setup them. In the sequel, we assume that your elasticsearch server has been started and the main kibana dashboard is available through http://<webserver-address>/kibana.
Configuration
Before starting haka, we need to enable in its configuration file the elasticsearch alerting module and set some parameters:[general]
# Select the haka configuration file to use.
configuration = "config.lua"
[packet]
#Select the capture model, nfqueue or pcap
module = "packet/pcap"
interfaces = "eth5"
[log]
# Select the log module
module = "log/syslog"
[alert]
# Select the alert module
module = "alert/elasticsearch"
# alert/elasticsearch module options
elasticsearch_server = "http://127.0.0.1:9200"
geoip_database = "/usr/share/GeoIP/GeoIP.dat"The above configuration tells haka to capture packet on eth0 interface using the pcap capture module and exports alerts to an elasticsearch server running on the local machine on port 9200. Moreover, thanks to geoip option, we will enrich our IDMEF-like alert format with geolocalization info.
Starting Haka
For testing purpose, we provide the following script config.lua that raises alerts with dummy data:
local icmp = require('protocol/icmp')
local tcp = require('protocol/tcp')
local udp = require('protocol/udp')

local function gen_alert(module, desc, severity, confidence, completion,  method_ref, method_desc)
    haka.rule {
        hook = module.events.receive_packet,
        eval = function (pkt)
            haka.alert{
                start_time = pkt.ip.raw.timestamp,
                description = desc,
                severity = severity,
                confidence = confidence,
                completion = completion,
                method = {
                    description = method_desc,
                    ref = method_ref
                },
                sources = { haka.alert.address(pkt.ip.src) },
                targets = { haka.alert.address(pkt.ip.dst) }
            }
        end
    }
end

gen_alert(icmp, "buffer overflow in proftpd", "high", "medium", "failed",
    { "cwe:121", "cve:2010-4221" }, "stack-based overlfow")

gen_alert(tcp, "format string bug in rwhoisd", "medium", "low", "successful",
    { "cwe:134", "cve:2001-0913" }, "format string bug")

gen_alert(udp, "sqli in wordpress plugin", "low", "medium", "failed",
{ "cwe:89", "cve:2014-5201" }, "sql injection")haka -c haka.confStarting with monitoring
The last step is to visit the main kibana page at http://<webserver-address>/kibana and load this dashboard. At this point, you should get info about alerts thrown by haka.